 Halloween – we just have to pay it some due on NerdBeach. After all, on what other day can you send the kids out to beg for candy without raising an eyebrow? And the decorations, which range from the simple to the exotic, all centered around the scary.
While not quite as daring as a bunch of electric lights wrapped around a very flammable dead tree, all of those artistically crafted pumpkins with live fire inside of them just has to be cool. And how about having an open license to scare anybody you deem deserving, all officially part of the fun?
Not to mention the costumes, from the imaginative and creative to the simple clever T-shirt that seemingly always shows up in a large enough sample of Halloween merry makers.
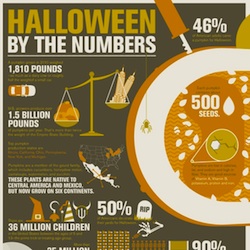
So, for that reason, here is a fascinating infographic that looks at the numbers associated with our spookiest holiday. The volumes just might make you pause…

Trick or Treat
The practice of dressing up in costumes and begging door to door for treats on holidays dates back to the Middle Ages and includes Christmas wassailing. Trick-or-treating resembles the late medieval practice of souling, when poor folk would go door to door on Hallowmas (November 1), receiving food in return for prayers for the dead on All Souls Day (November 2). It originated in Ireland and Britain, although similar practices for the souls of the dead were found as far south as Italy.
source:wikipedia